Opts
- learner_names(Lnames)
- used to distinguish the models for each learner, an l prefixed atom is used by default
- names(Names)
- Names for Models. Unlike other non
post()options, who are passed on to Post calls via options, this is passed to explicitly. This not used in main call, and it defaults to model_01...model_NN If a variable, the generated names are returned. - post(Post)
- Post processing after Models + Statistics are constructed
Known Post values:
- jitter
- statistic_names(StaNames)
- names for the statistics
Additional Opts for the Post are allowed. For each Post, all options with matching outer term name
are stripped and passed. For instance jitter(accuracy(2,'AUC')) is passed to Post jitter, and
it signifies that the predictor passes as it is second argument the AUC of the model against the
leave out segment. The implementation is expected correct at the predictor end, here we just
provide means to pass the information to the plotter.
Also see options for k_fold_learn/4.
Jitter
- accuracy(N, Name)
- the Nth (>1) position of the statistic is accuracy identified by Name
- accuracy(Pname)
- predicate name for obtaining the accuracy names, called as
call(Pname,N,Name) - average_accuracy(Avg=mean)
- R function for obtaining the single accuracy from the k_fold accuracies
- rerun_ground(Rerun=true)
- set to false to avoid re-runing ground models. Convenient for running comparatives
    ?- [pack(mlu/examples/stoic)].

    ?- stoic.  % use ?- stoic_ng.  % if you do not have library(real).
Opts
- pairs(Pairs)
- list or single pair (L1-L2) of predictions to consider
?- Data = [r,a,b,c,d,e,f], k_fold_segments( Data, H, Sgs, folds(3) ).
Data = [r, a, b, c, d, e, f], H = r,
Sgs = [[a, d], [b, c], [e, f]].

?- Data = [r,a,b,c,d,e,f], k_fold_segments( Data, H, Sgs, [folds(3),by_permutation(false)] ).
Data = [r, a, b, c, d, e, f], H = r,
Sgs = [[b, e], [c, d], [a, f]].
Opts
- by_permutation(By=false)
- whether to create segments by a single permutation operation. Althernative is by sequentially chossing bins for each datum until all bins are full (and Data is empty).
- folds(K=10)
- number of segments to split the data to (exhaustive and mutual exclusive splits)
Pack mlu uses pack pack_errors for throwing errors.
File mlu_errors.pl defines local errors within the pack_errors infrastructure.
Currently the predicate: copy_terms Goal and Yield, and requires that Yield's copy will be ground after Goal's copy is called.
Opts
- repeats(R=false)
- if
integer(R), the V in Pairs is a list of results (length(V)= R)
?- lib(pepl).
?- sload_pe( coin ).
?- mlu_sample( scall(coin(Side)), 100, Side, Freqs ).
Freqs = [head-47, tail-53].

?- mlu_sample( scall(coin(Side)), 100, Side, Freqs ).
Freqs = [head-49, tail-51].
Data is one of
- pairlist
- of the form, Item-Times
- list
- that is passed, with Opts, to list_frequency/3
- vector
- the values of which are retrieved with pl_vector/3, and then \br passed, with Opts, to list_frequency/3
Opts
- interface(Iface)
- barplot, or gg_bar interfaces are supported. The first requires
lib(real), in addition the latter also requireslib(b_real). If b_real is present, the second interface becomes the default. - pop_breaks(Breaks=false)
- colour population groups according to given break points. Splits are done with =< so break points go to the left partition. (Currently only for gg_bar interface.)
- pop_line(PlineAt=false)
- if integer draws a vertical line separating columns with counts less than PlineAt to those with more. Only makes sense if Sort is set to frequency. (Currently only for gg_bar interface.)
- sort(Sort=false)
- alternatives to not sorting (default)
- elem/element
- sort by element
- true/freq/frequency
- sort on frequency
Other options are passed to either gg_bar_plot/2 (if Iface == gg_bar) or to r_call/2 (if Iface == barplot).
?- lib(pepl).
?- sload_pe( coin ).


?- [pack(mlu/examples/grouped_freqs)].
?- grouped_freqs.
% a plot with 9 bars and 3 groups should appear on screen

?- mlu_frequency_plot( [1,1,1,2,2,3], true ).
?- mlu_frequency_plot( [1,1,1,2,2,3], interface(barplot) ).
?- mlu_frequency_plot( [1,1,2,11,12,21,31,33,41], [bins([10,20]),interface(gg_bar)] ).
The plot produced has binned Data into 3 bins.
?- mlu_frequency_plot( [1,1,2,11,12,21,31,33,41], [bins([bin1-10,bin2-20,bin3-inf]),interface(gg_bar)] ).
As previous example, but x tics are custom labelled.
?- mlu_frequency_plot( [1,2,10,11,12,21,31,33,41], [bins([0-10]),interface(gg_bar)] ).
?- lib(pepl).
?- sload_pe( coin ).
?- mlu_sample( scall(coin(Side)), 100, Side, Freqs ), mlu_frequency_plot( Freqs, [interface(barplot),outputs([svg]),las=2] ).
Produces file: real_plot.svg
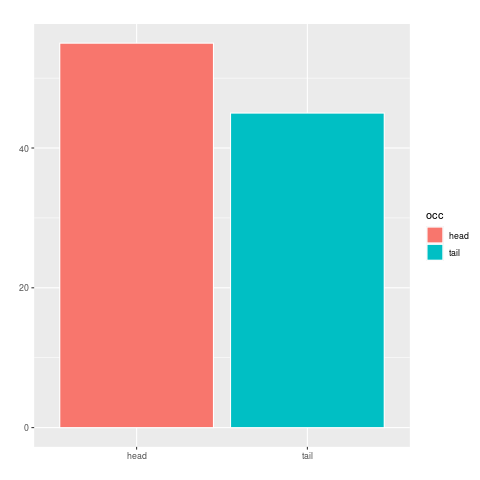
?- mlu_sample( scall(coin(Side)), 100, Side, Freqs ), mlu_frequency_plot( Freqs, [interface(gg_bar),output(png("naku.png"))] ).
Produces file: naku.png
?- mlu_version( V, D ).
V = 0:5:0,
D = date(2022, 12, 29).